
Portfolio Cuts: A Graph-theoretic Framework To Diversification
In our research, we sought to address the well-known limitations of traditional portfolio optimization methods, particularly Mean-Variance Optimization (MVO). While MVO has been a fundamental tool in finance since its introduction by Harry Markowitz in 1952, it is notorious for its sensitivity to small perturbations in input data, leading to unstable and often suboptimal portfolio allocations. To overcome these challenges, we have developed a novel graph-theoretic framework for portfolio diversification, which we refer to as "Portfolio Cuts."
The core innovation of this framework is the idea of viewing a collection of assets as a graph. Imagine each asset as a point, or vertex, and the connections between them as lines, or edges. These edges reflect the relationships between the assets, particularly how their returns are correlated. This graphical representation allows us to capture the intricate structure of the market, something traditional methods tend to overlook. By analyzing this structure, we can better understand the complex interactions within a portfolio, leading to more informed investment decisions.
One of the most exciting aspects of our research is the technique we developed called "Minimum Cut Based Vertex Clustering." In simple terms, this involves dividing the asset graph into separate clusters in such a way that the connections between these clusters are minimized. The challenge here is that finding the perfect division is a complex, computationally demanding task, making it practically impossible for large graphs. However, we found a way to approximate this division using a method based on the graph's structure, allowing us to identify nearly optimal clusters without getting bogged down by computational limits.

A cut for a graph with the disjoint subsets V1 = {1, 2, 3, 4} and V2 = {5, 6, 7, 8}. The edges between the sets V1 and V2 are designated by thin red lines. The cut is equal to the sum of the weights that connect the sets V1 and V2, that is, Cut(V1, V2) = 0.32 + 0.24 + 0.23 = 0.79.
To make this process more efficient, we introduced an approach called spectral bisection. Instead of searching through all possible ways to divide the graph, we use the graph's underlying characteristics to guide us towards a good solution. This method allows us to divide the graph into two parts that are nearly independent of each other. And by repeating this process, we can break the graph down into even more refined clusters, further enhancing the portfolio's structure. By applying these cuts repeatedly, we can create a detailed, hierarchical breakdown of the asset graph. This allows for a much more nuanced and diversified approach to asset allocation, where each cluster of assets is treated as a distinct entity. The result is a portfolio that not only spreads risk more effectively but also adapts to the underlying market structure in a way that traditional methods simply can't match.
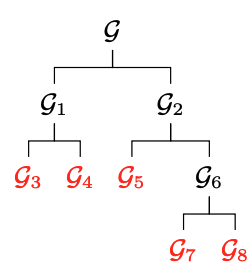
Graph asset allocation strategies. Graph structure resulting from K = 4 portfolio cuts.
Through extensive testing with real-world data, particularly focusing on the S&P 500, we found that our graph-theoretic approach consistently outperformed traditional strategies. The portfolios created using our methods were more stable, exhibited lower variance, and delivered better risk-adjusted returns. This success underscores the potential of graph theory as a powerful tool in the world of finance, offering a fresh perspective on portfolio construction that is both innovative and practical.

Out-sample performance of the asset allocation strategies. Notice that the Sharpe ratio typically improves with each subsequent portfolio cut. The traditional portfolio strategies, EW and MV, attained the respective Sharpe ratios of SR-EW = 1.85 and SR-MV = 1.6.
Our research presents a novel, graph-based approach to portfolio diversification that overcomes many of the limitations of existing methods. By reimagining assets as interconnected points in a network, we can develop portfolios that are not only more stable but also better aligned with the realities of the market. This framework holds promise for the future of financial strategy, providing a more resilient and adaptive way to manage investments in an increasingly complex world.
For a detailed read of the paper, please see: https://ieeexplore.ieee.org/document/9054371